Usage
Delta Graphs (also known as Trend Graphs) are used to describe how some specific object or value is changing over time. For example, how ROM Memory Usage is changing during the project.
There are several different types of graphs that can be drawn:
- Component Deltas
- Memory Deltas
- Memory Segment Deltas
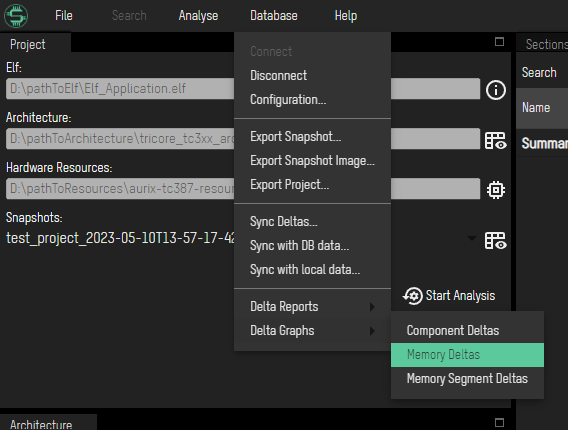
In order to get them, go to Database → Delta Graphs
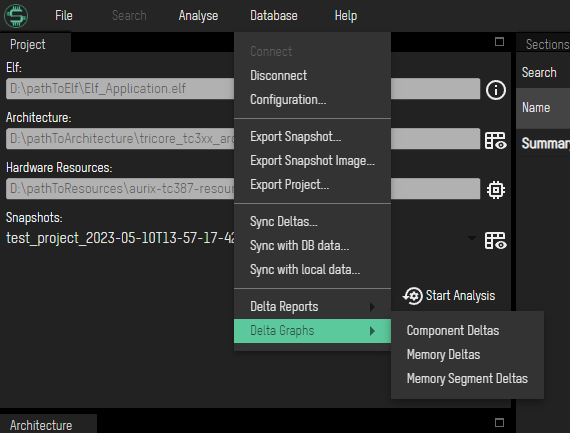
to open the nested Graphs Menu and pick one of the options.
Component Deltas Graph
In order to get graphical representation of component deltas, choose Delta Graphs → Component Deltas
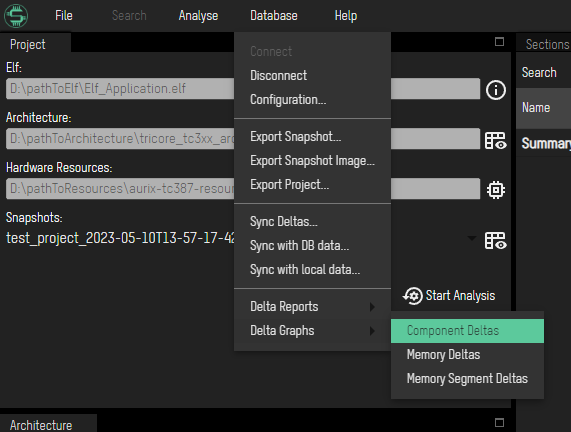
to open Component Deltas Window
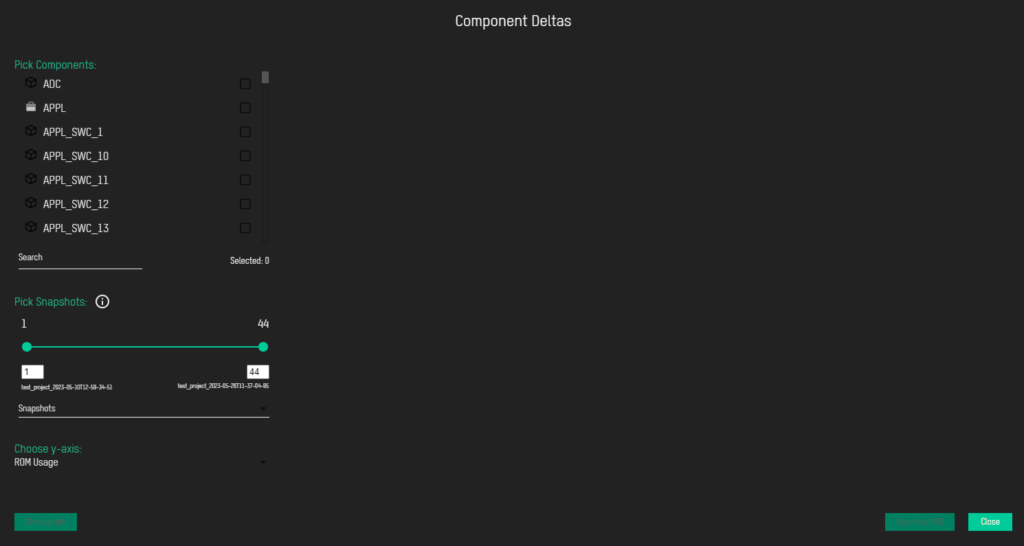
Pick Components
Here you can find the list of all components in your project. Beside each name, there is a small icon representing the type of the component – layer or software component.
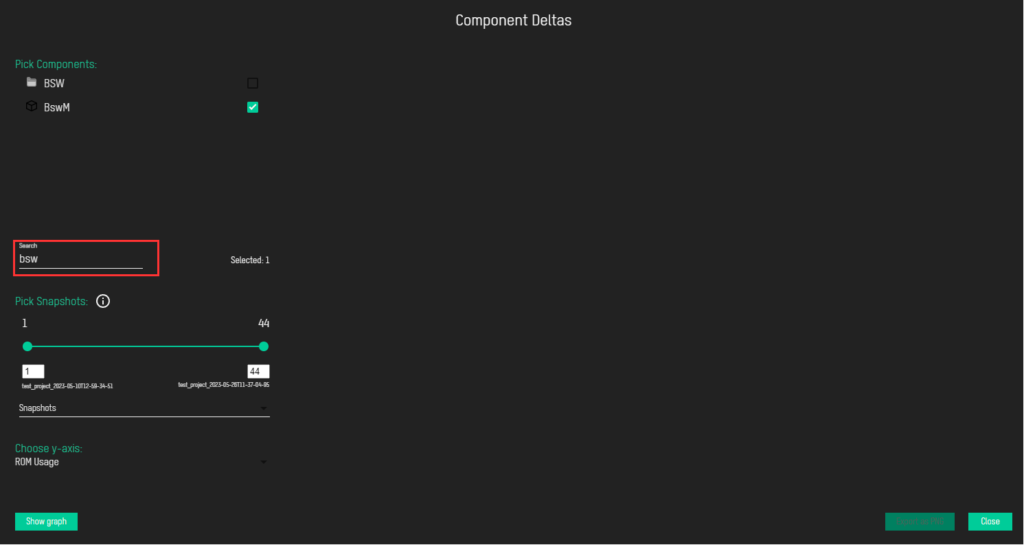
To get graphs for any of them, you should first select the ones you want. There is a counter below the list – Selected: count where you can track how many components you have selected
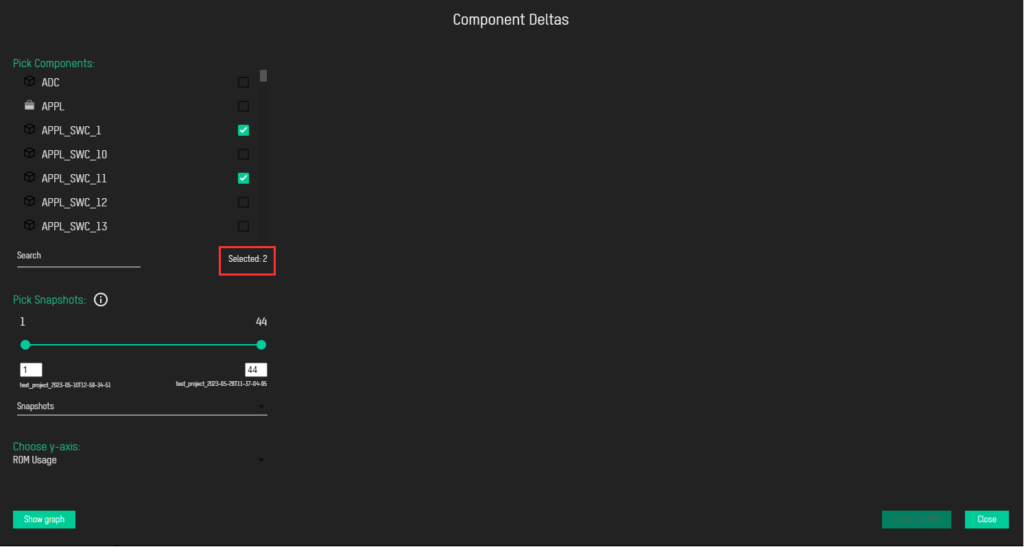
If you want, for example, some specific component, there is no need to scroll to find it, you can use Search option instead. Just select the form, type the name of the component and select it.
Pick Snapshots
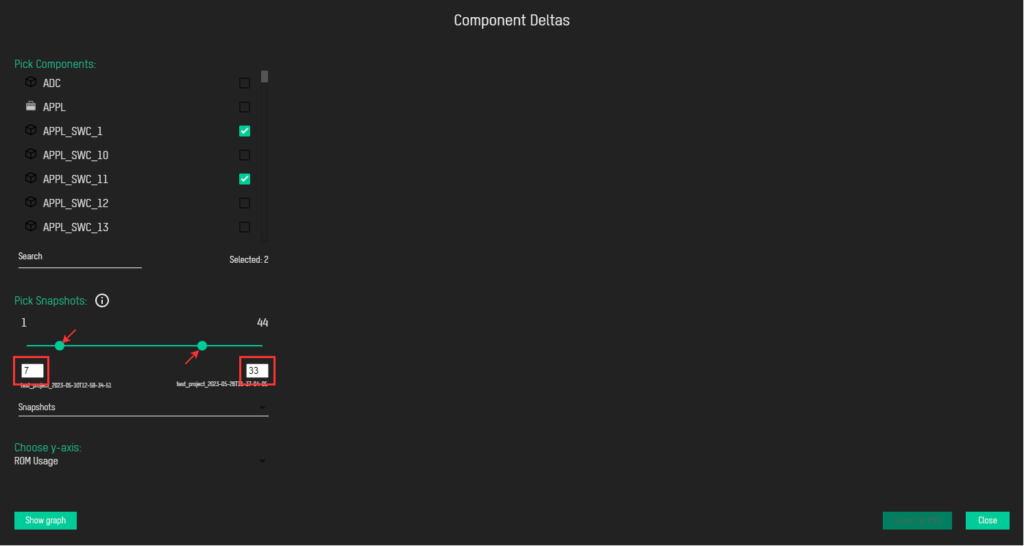
Here can be found all snapshots from the project. You can specify the range of snapshots you want to include in graph. By default, all snapshots are included. For this purpose, you can use slider, or input boxes below slider.
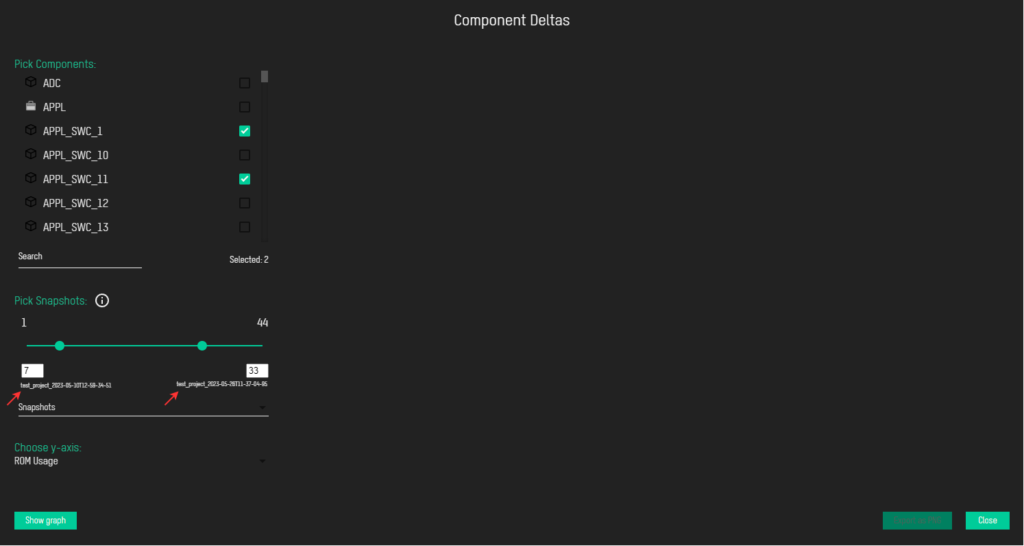
and below input boxes you can find the name of the snapshot you have picked
Also, there is a drop-down list of snapshots just below, which expands as you click on it
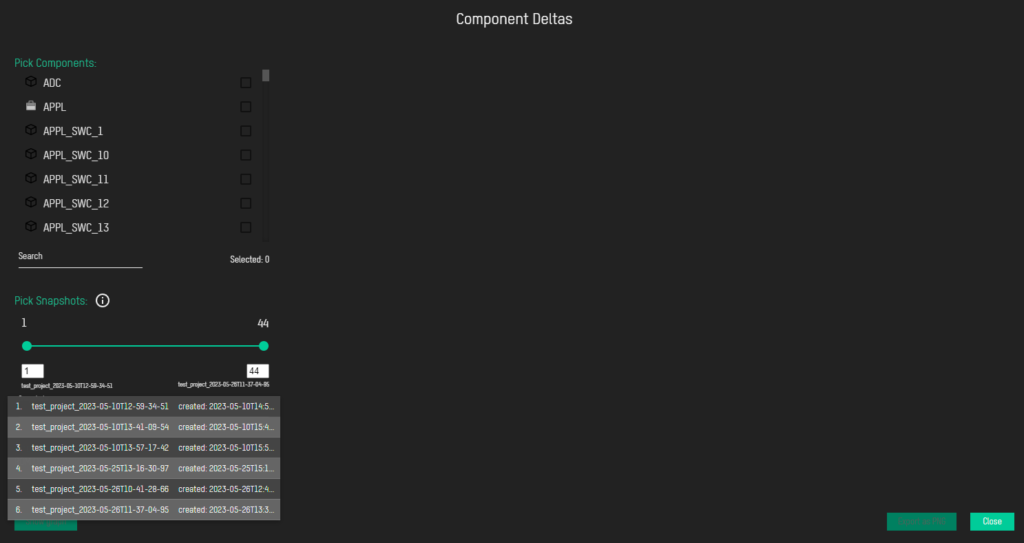
so that you can easily find out the ordinal number of the snapshot you are including in graph. Beside names, there is also creation time of every snapshot.
Choose y-axis
Choosing the y-axis determines what values will be drawn in graph. By clicking on the form, you will get the expanded list of available options
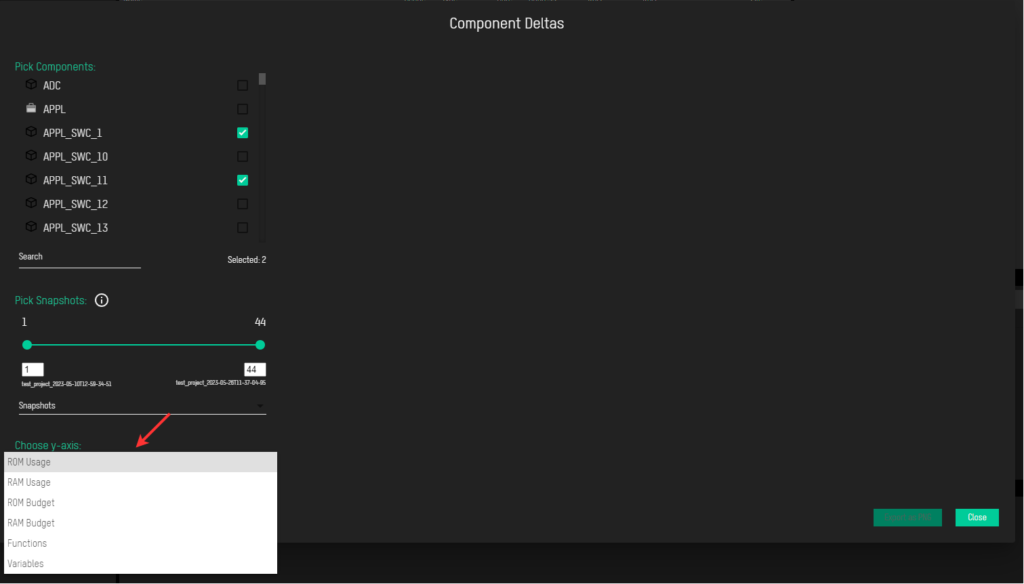
The first one (ROM Usage) is selected by default.
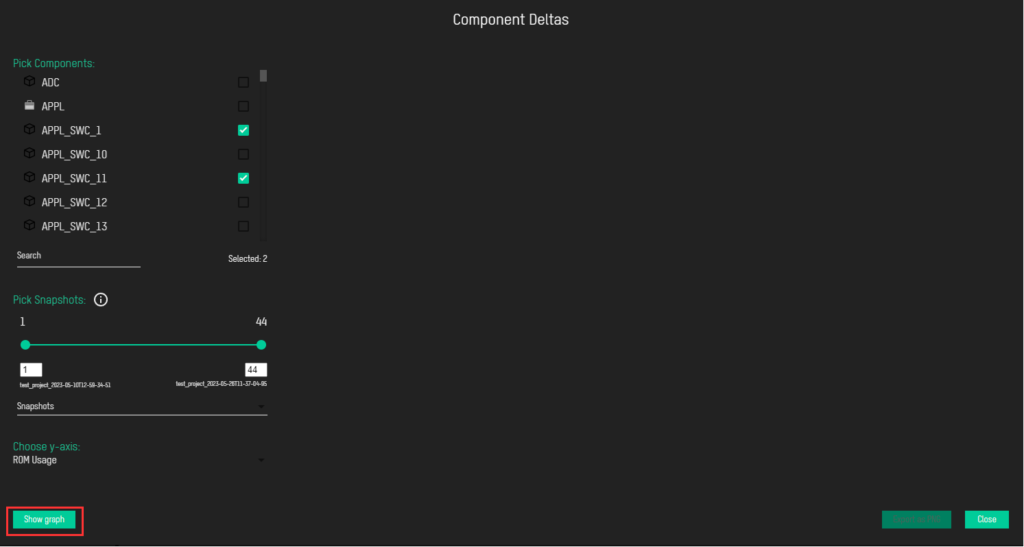
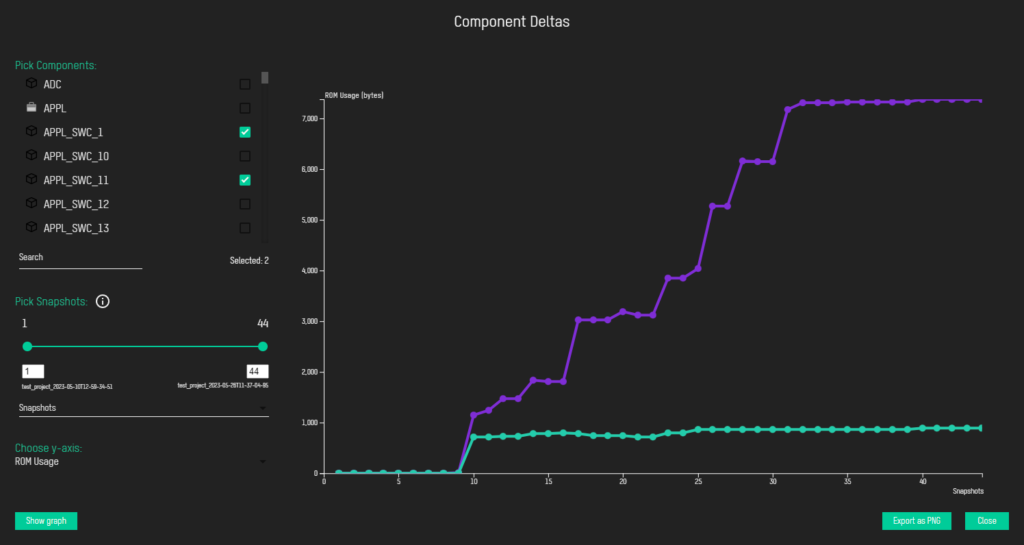
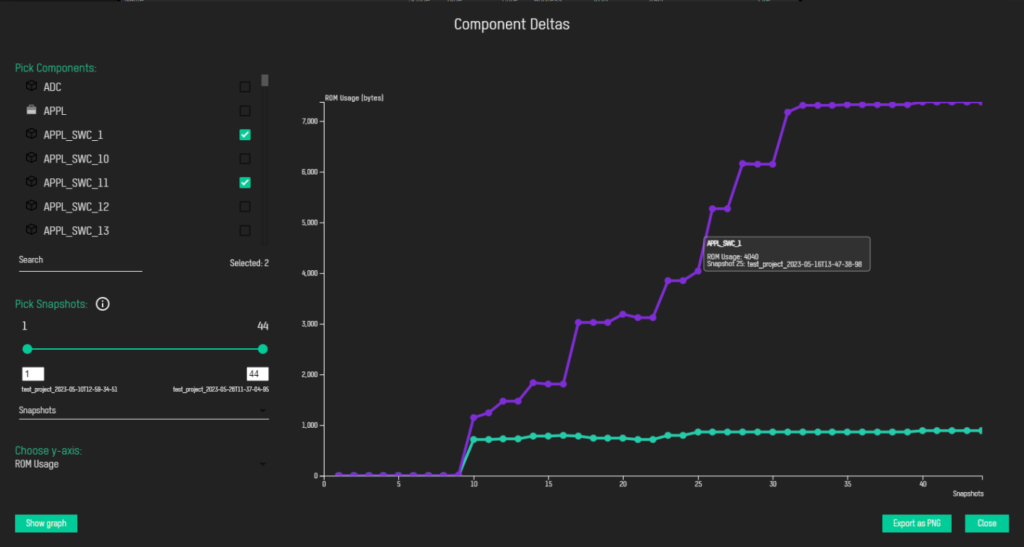
Once you have selected component(s), snapshots and y-axis, you can click on Show graph button, to draw the graph
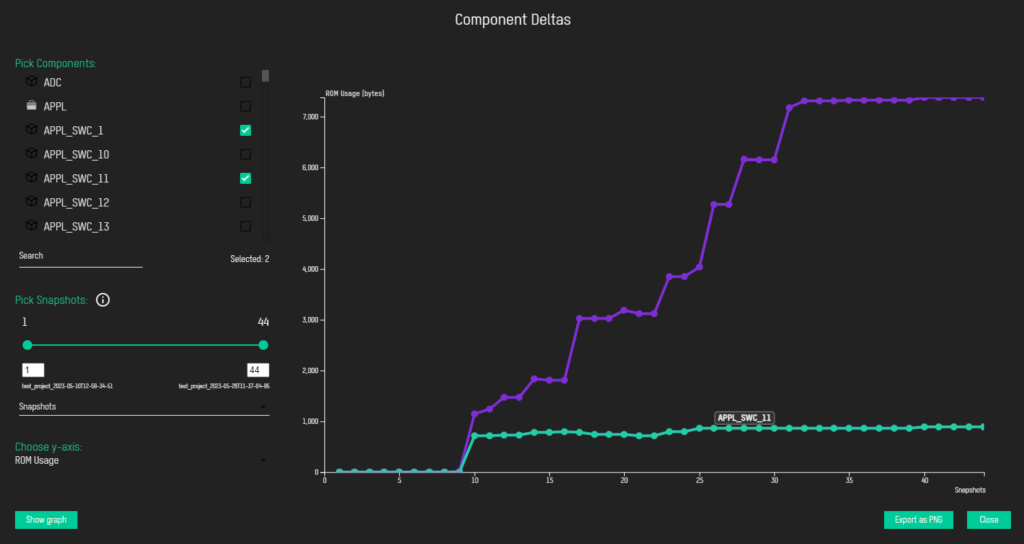
To be sure which graph represents which component, hover the mouse over the line to get the tooltip with the component name
and to see the exact values of x and y axes, hover the mouse over the dot
To save the graph as a picture, click on Export as PNG button
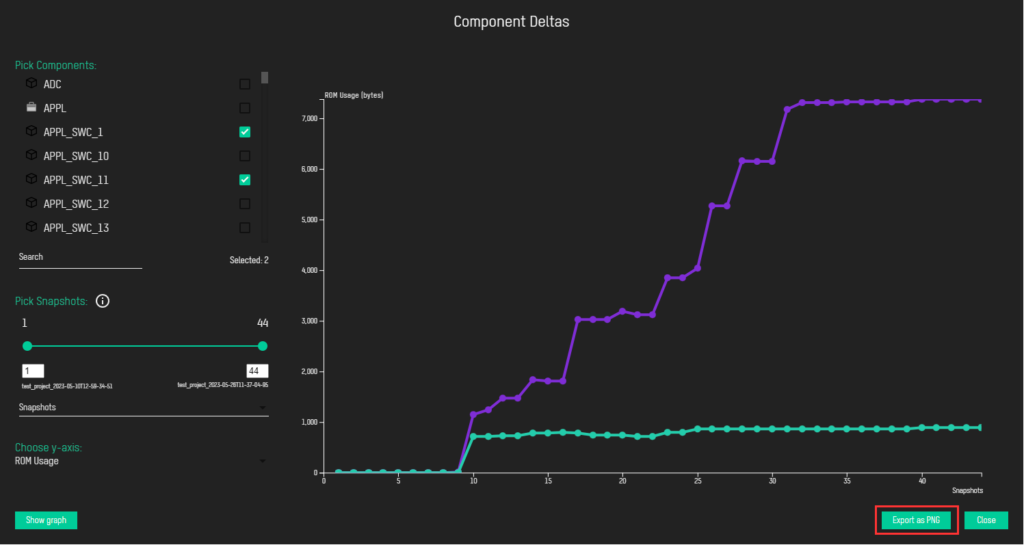
to open File Explorer where you can choose the location where it is going to be saved.
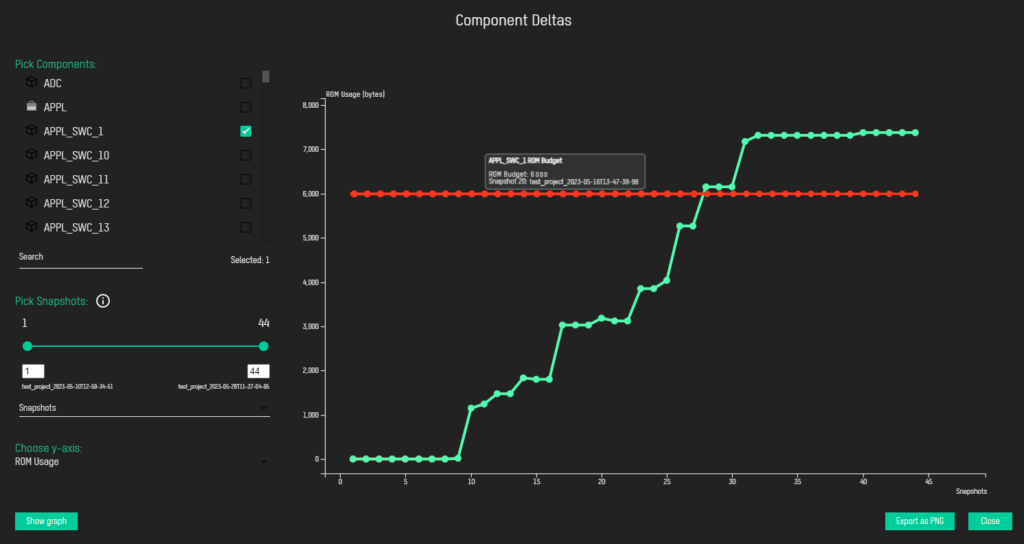
There is one special situation for graphs. If you pick one component, and ROM/RAM Usage for y-axis, beside graph for ROM/RAM Usage, there will be also drawn a graph for ROM/RAM Budget for that component, so you can track if your component memory usage has gone over the predefined budget
Memory Deltas Graph
In order to get graphical representation of memory deltas, choose Delta Graphs → Memory Deltas
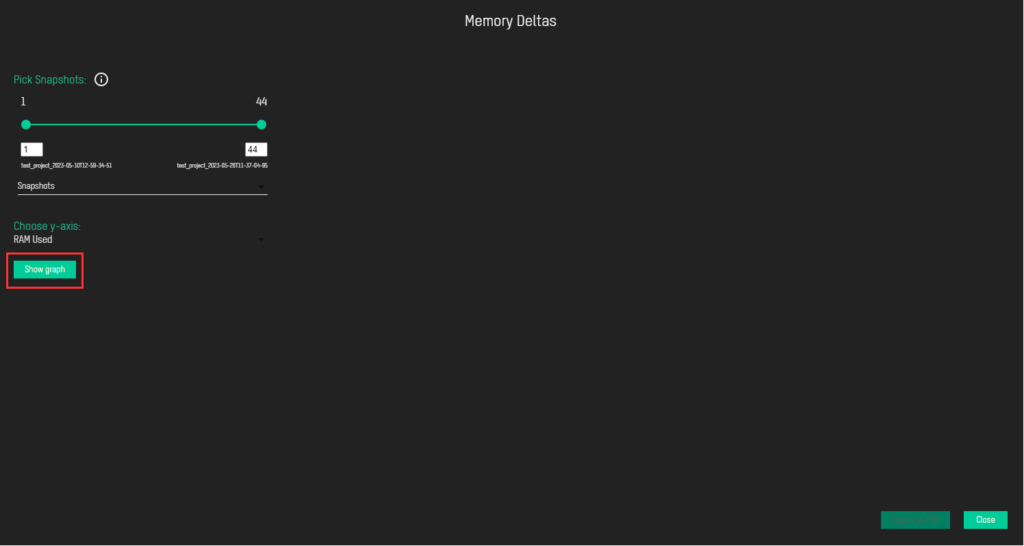
to open Memory Deltas Window
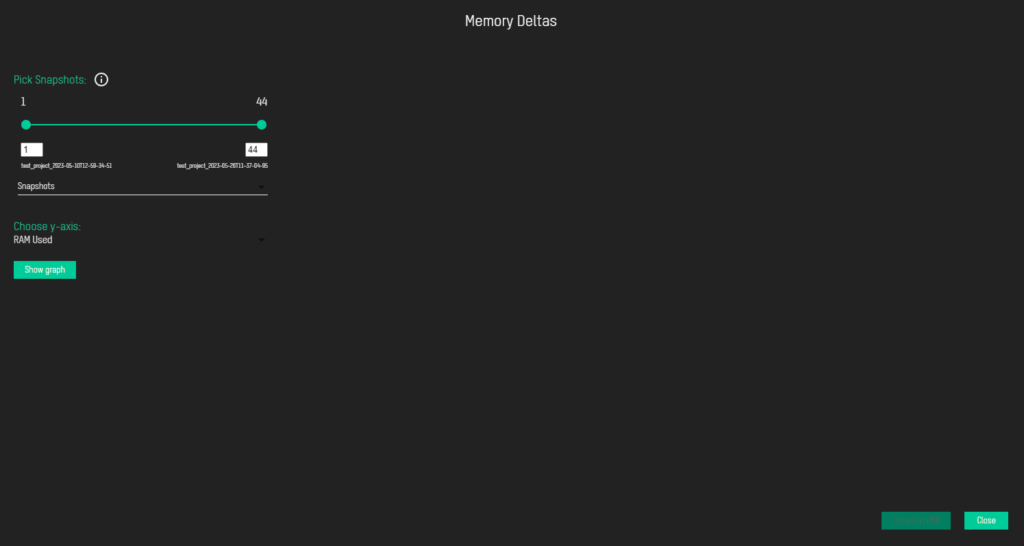
Pick Snapshots
Here can be found all snapshots from the project. You can specify the range of snapshots you want to include in graph. By default, all snapshots are included. For this purpose, you can use slider, or input boxes below slider.
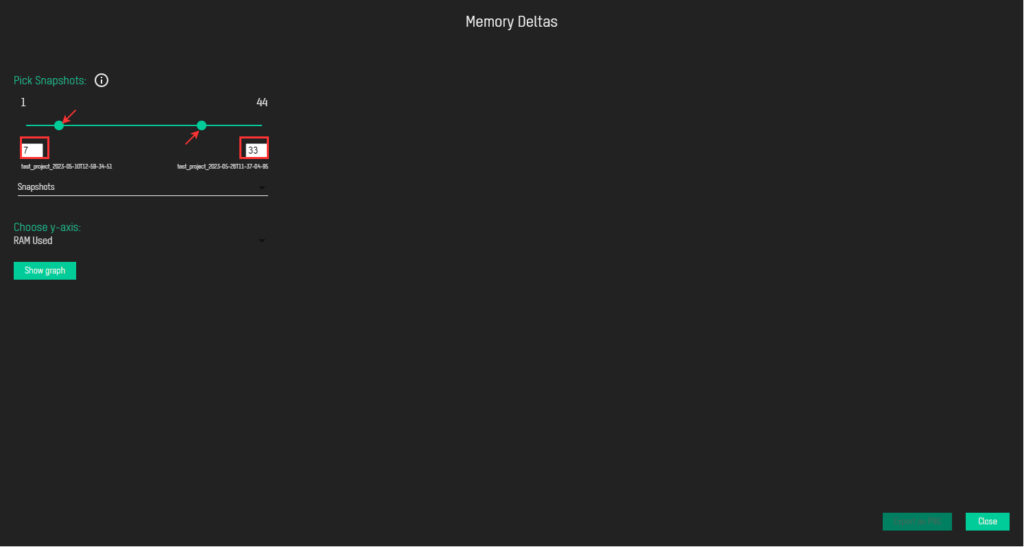
and below input boxes you can find the name of the snapshot you have picked

Also, there is a drop-down list of snapshots just below, which expands as you click on it
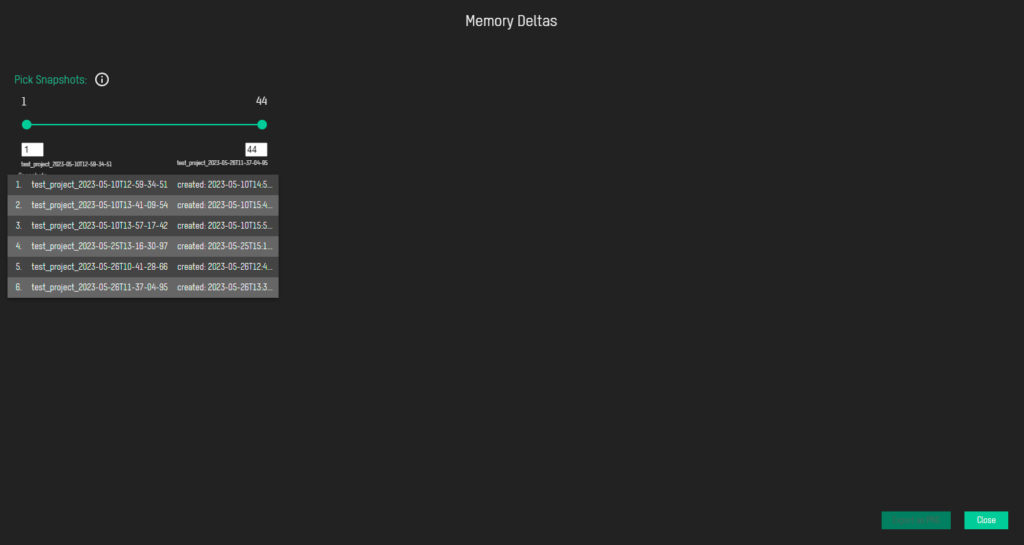
so that you can easily find out the ordinal number of the snapshot you are including in graph. Beside names, there is also creation time of every snapshot.
Choose y-axis
Choosing the y-axis determines what values will be drawn in graph. By clicking on the form, you will get the expanded list of available options
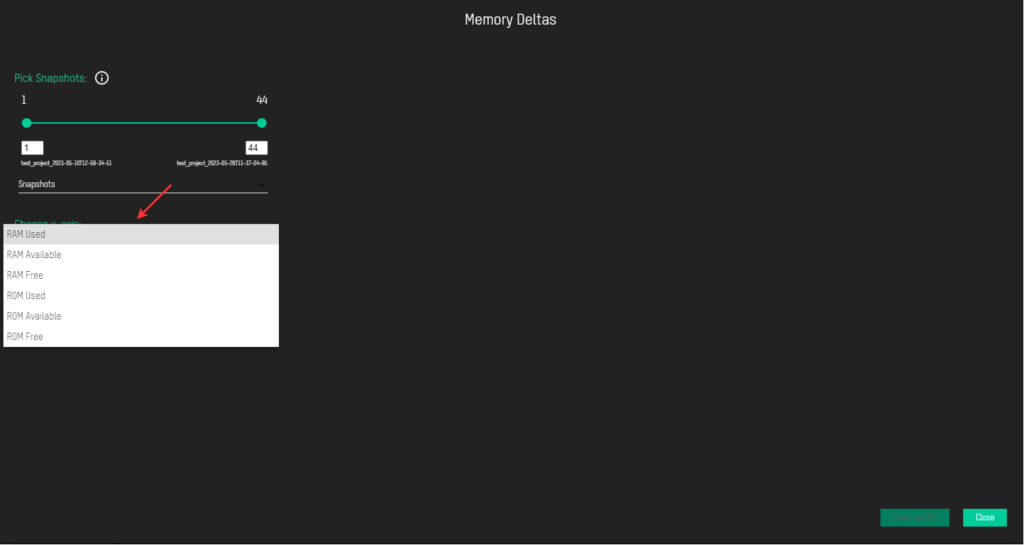
The first one (RAM Used) is selected by default.
Once you have selected snapshots and y-axis, you can click on Show graph button, to draw the graph
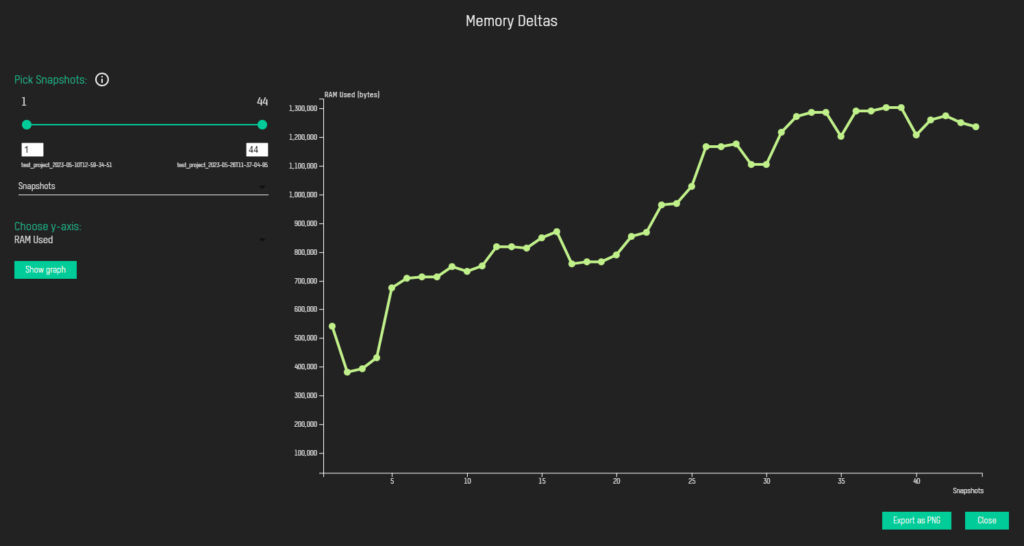
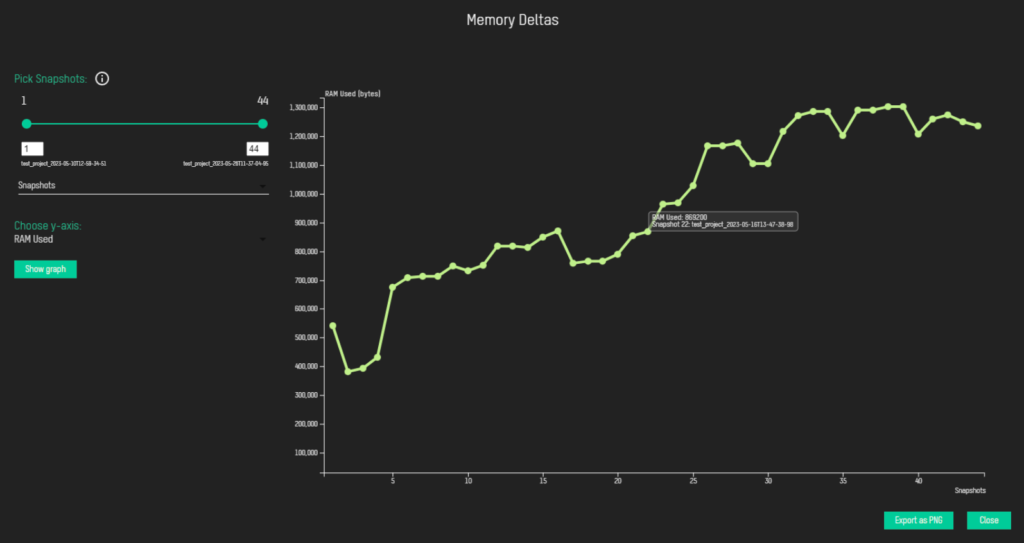
To see the exact values of x and y axes, hover the mouse over the dot
To save the graph as a picture, click on Export as PNG button
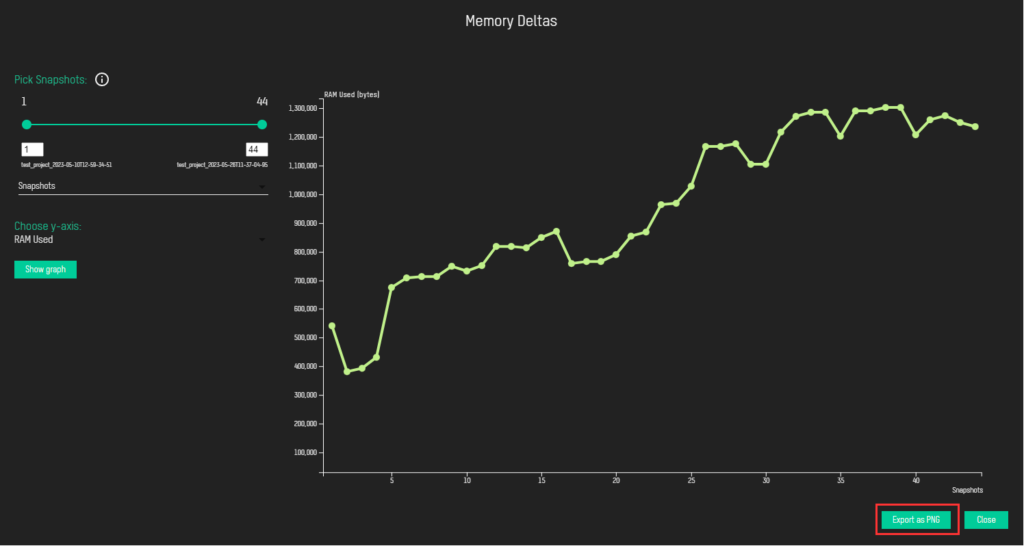
to open File Explorer where you can choose the location where it is going to be saved.
Memory Segment Deltas Graph
In order to get graphical representation of memory segment deltas, choose Delta Graphs → Memory Segment Deltas
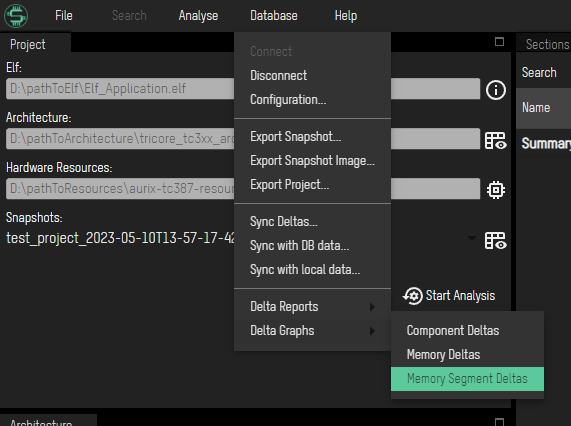
to open Memory Segment Deltas Window
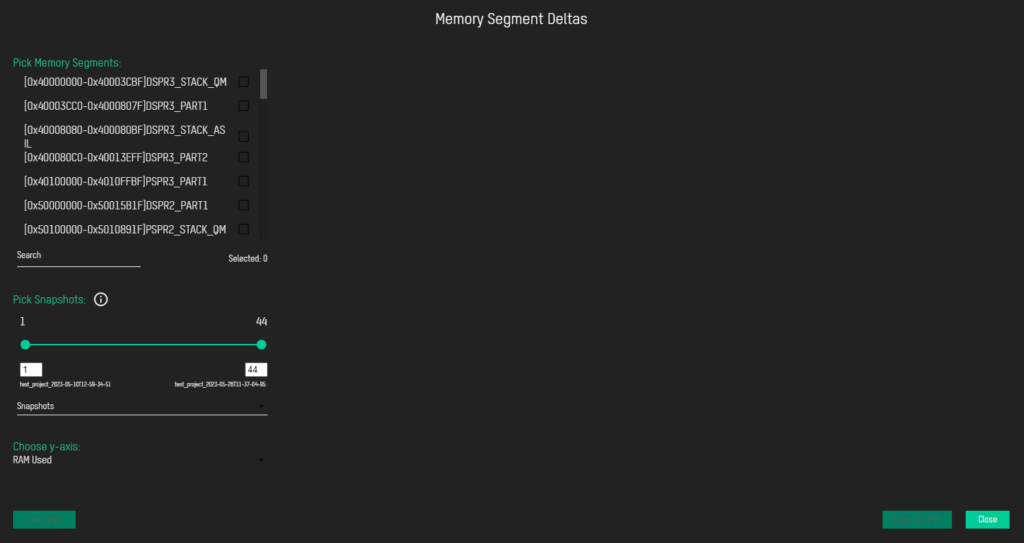
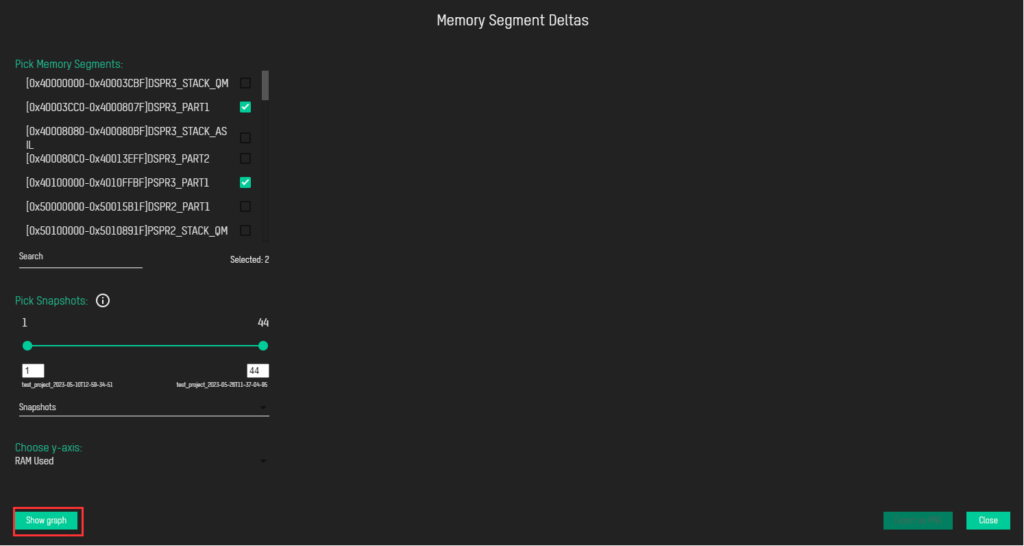
Pick Memory Segments
Here you can find the list of all memory segments in your project. They are represented with memory range and memory segment name.
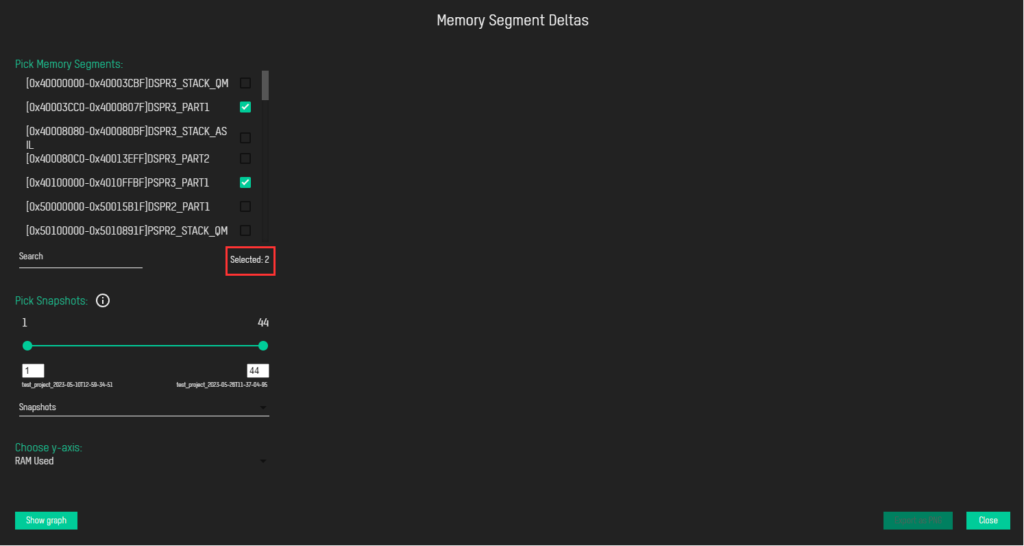
To get graphs for any of them, you should first select the ones you want. There is a counter below the list – Selected: count where you can track how many memory segments you have selected
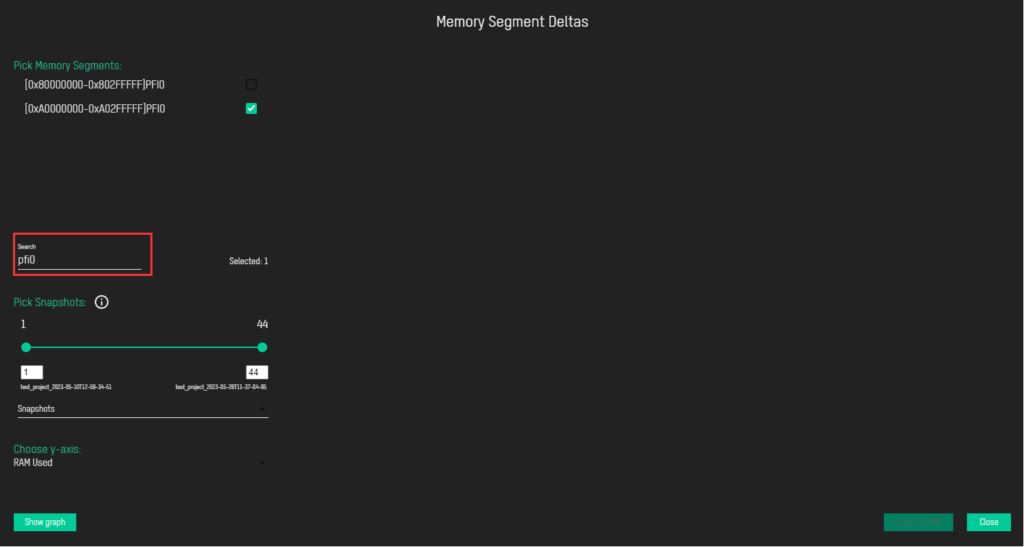
If you want, for example, some specific memory segment, there is no need to scroll to find it, you can use Search option instead. Just select the form, type the name of the memory segment and select it.
Pick Snapshots
Here can be found all snapshots from the project. You can specify the range of snapshots you want to include in graph. By default, all snapshots are included. For this purpose, you can use slider, or input boxes below slider.
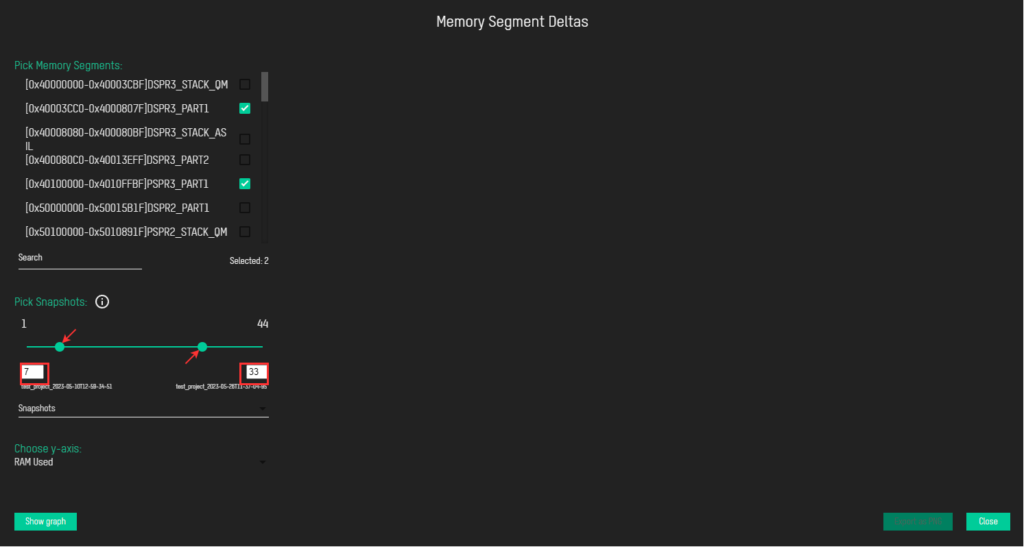
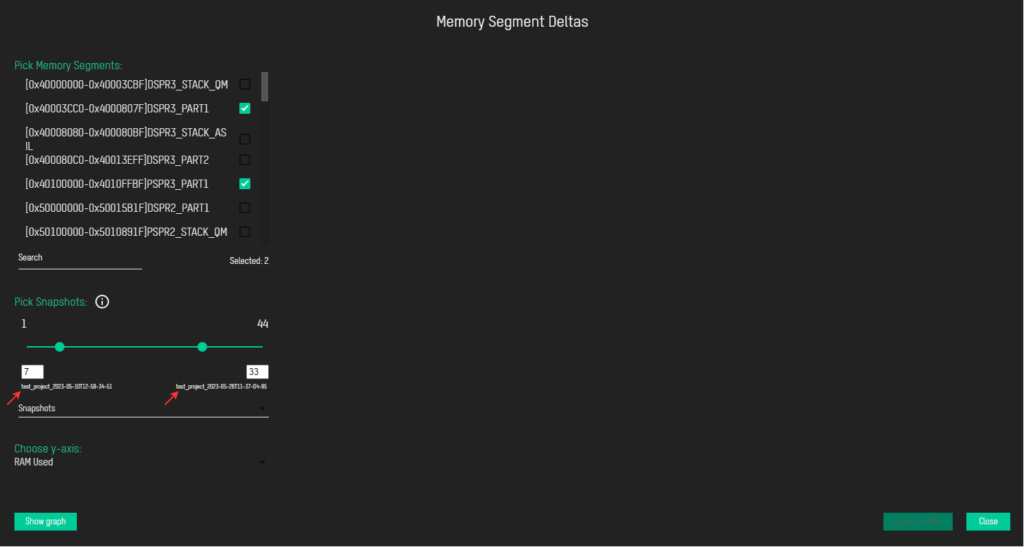
and below input boxes you can find the name of the snapshot you have picked
Also, there is a drop-down list of snapshots just below, which expands as you click on it
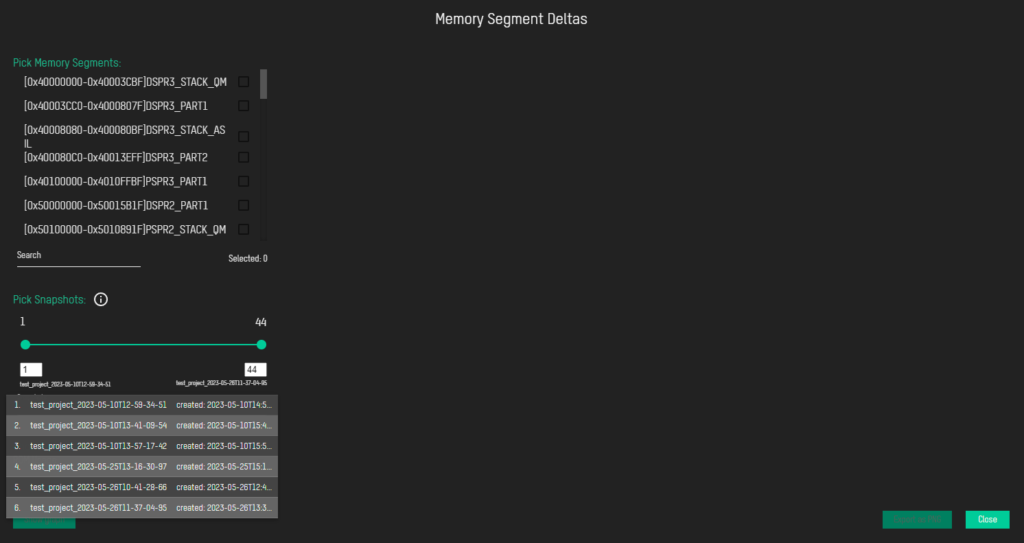
so that you can easily find out the ordinal number of the snapshot you are including in graph. Beside names, there is also creation time of every snapshot.
Choose y-axis
Choosing the y-axis determines what values will be drawn in graph. By clicking on the form, you will get the expanded list of available options
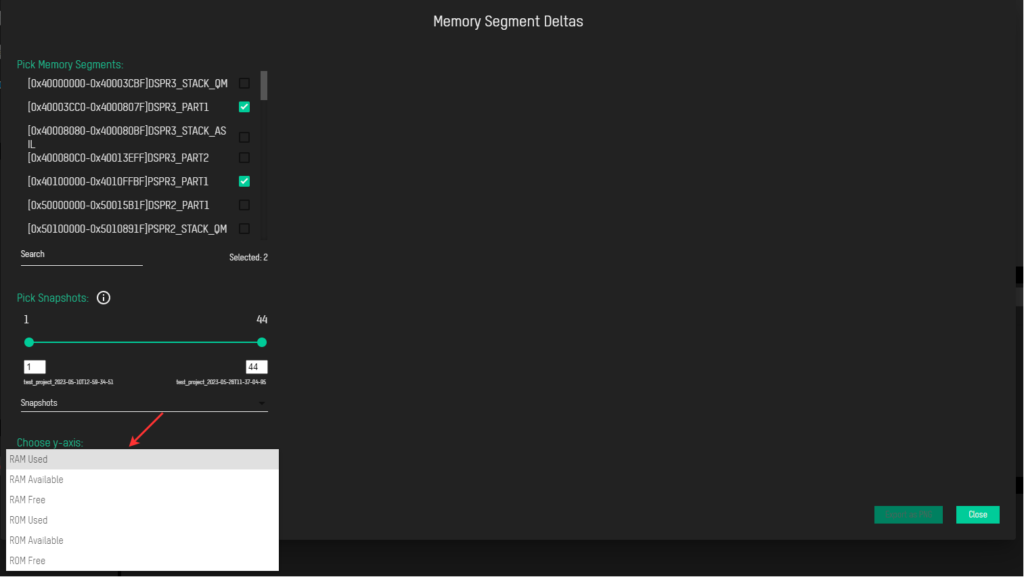
The first one (RAM Used) is selected by default.
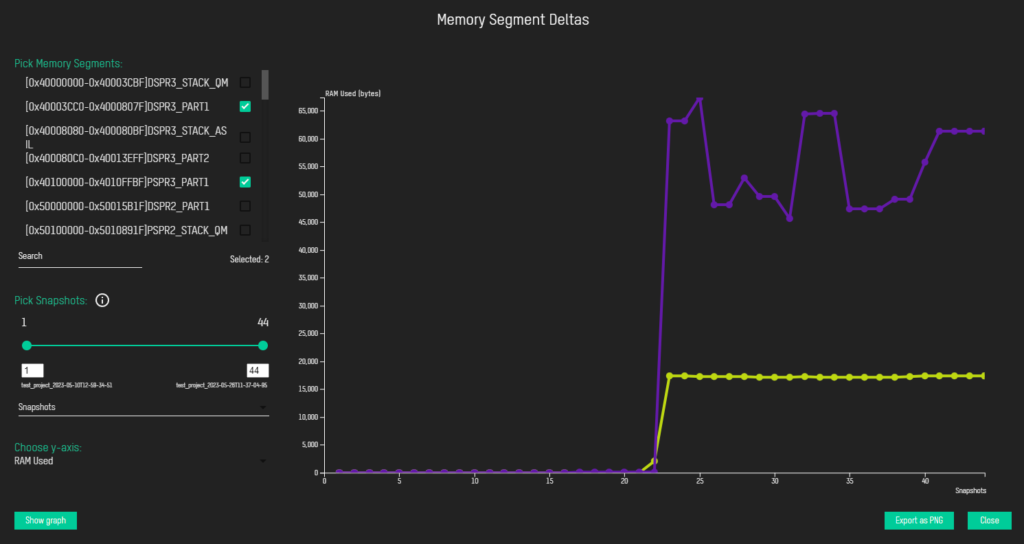
Once you have selected memory segment(s), snapshots and y-axis, you can click on Show graph button, to draw the graph
To be sure which graph represents which memory segment, hover the mouse over the line to get the tooltip with the memory segment name
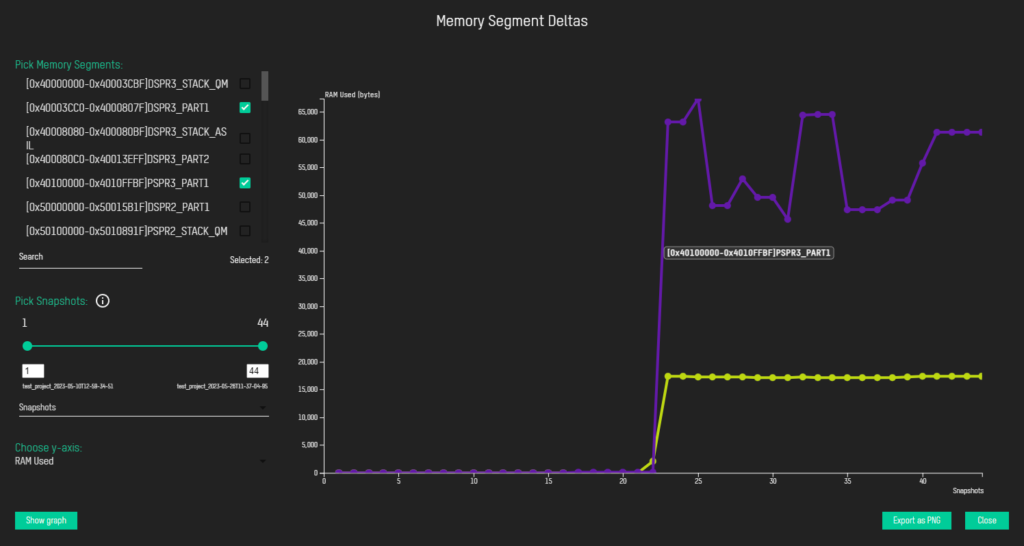
and to see the exact values of x and y axes, hover the mouse over the dot
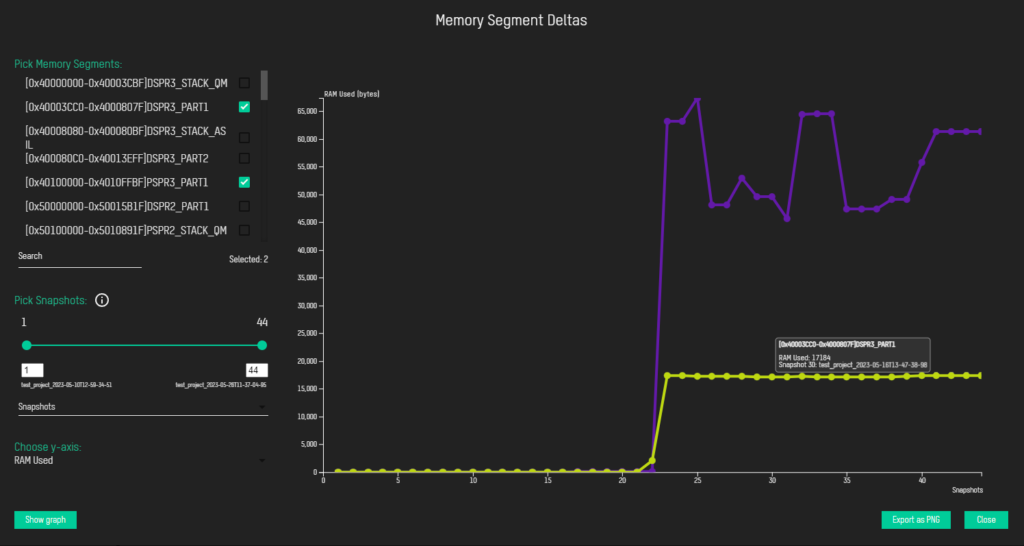
To save the graph as a picture, click on Export as PNG button
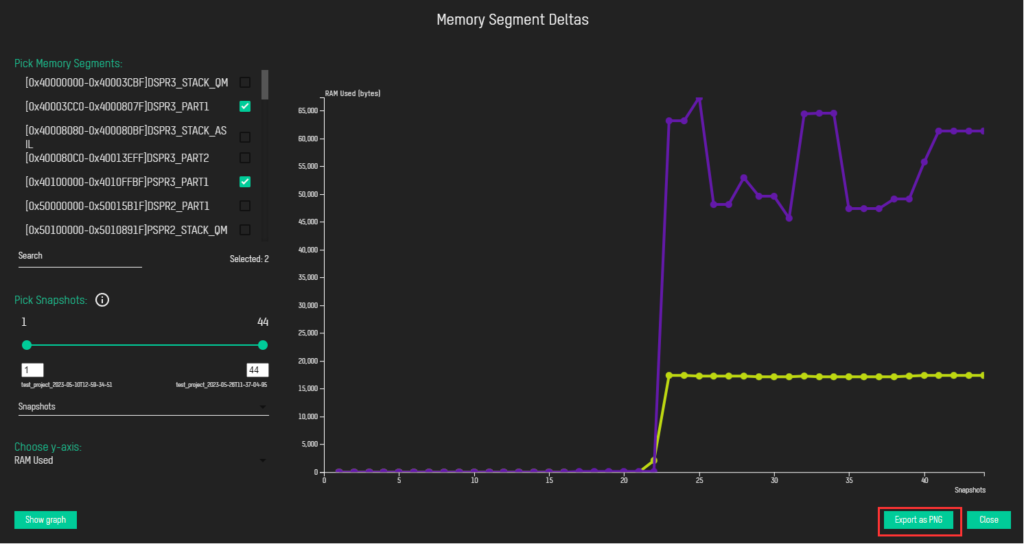
to open File Explorer where you can choose the location where it is going to be saved.